| Polygon Intersections |
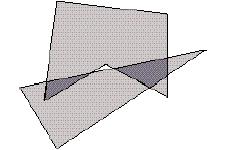
Most drawing or illustration programs have simple tools for creating polygon objects. The better ones can find the regions that are the intersections of two polygons. The picture below shows two polygons, one is a pentagon and the other is a triangle. Their intersection consists of the two dark regions.
IBM has just hired you as a member of a programming team that will create a very sophisticated drawing/illustration program. Your task is to write the part of the program that deals with polygon intersections. Your boss has told you to delay work on the user interface and focus only on the geometric representations of the intersections.
A polygon in the Cartesian plane can be represented by a sequence of points that are its vertices. The vertices in the sequence appear in the order in which they are visited when traveling clockwise around the polygon's boundary; so any two adjacent vertices in the sequence are the endpoints of a line segment that is one of the polygon's sides. The last and the first vertices in the sequence are also endpoints of a side. Vertices are identified by their x- and y- coordinates. Assume the following about each polygon.
The intersection of two polygons consists of 0 or more connected regions. Your problem is to take two polygons and determine the regions of their intersection that are polygons satisfying the criteria above.
The following sample input contains exactly one data set. (The data set corresponds to the illustration at the beginning of this problem description.)
3 2 1 0.5 3.5 8 5
5 1.5 3 2 7 6.5 6.5 6.5 3.25 4 4.5
0
0
Data Set 1
Number of intersection regions: 2
Region 1:(1.50,3.00)(1.59,3.72)(3.25,4.05)
Region 2:(4.43,4.29)(6.50,4.70)(6.50,4.00)(5.86,3.57)